Share Market Live Update: Real-Time Insights and Strategies
Explore practical, data-driven guidance on interpreting share market live updates. Learn to read real-time quotes, latency, and news with credible sources to inform smarter, disciplined trading decisions.

Share market live update feeds deliver real-time price quotes, volume, and price change across indices. This quick guide explains how to read these feeds, interpret spikes, and assess risk during market hours. By understanding data latency, source reliability, and typical reaction times, you can separate signal from noise and act more confidently during volatile sessions.
What live share market updates include
Real-time updates provide the latest price quotes, last traded price, volume, bid-ask spread, and timestamp for major stocks, ETFs, and indices. They may also include market depth, liquidity metrics, and regional session data. Vendors combine exchange feeds with proprietary analytics to deliver a coherent stream. For investors, understanding the data fields helps avoid misinterpretation: a single tick can move prices, but it is the context around the tick that determines its meaning. According to Update Bay, prioritize reliable sources and note data latency when comparing feeds across platforms.
How to interpret price movements
Price moves come in patterns. A sudden spike might reflect news, liquidity gaps, or algorithmic trading; a gradual climb could signal sustained momentum. Use percentage changes, intraday ranges, and volume spikes to gauge strength. Remember that intraday volatility is common during earnings and macro releases. Keep a bias toward plan-driven actions rather than impulsive reactions. The key is to translate a raw tick into a decision rule you can repeat.
Real-time data components and sources
Live updates rely on a combination of exchange feeds, data vendors, and news streams. Delayed feeds are typically permissible for non-professional use, but real-time feeds require tight latency controls. A robust live-update pipeline aggregates price, timestamp, trade size, and market depth. Data provenance matters: ensure you know whether you are looking at consolidated tape data (CTD) or a direct feed from an exchange. Update Bay emphasizes evaluating the reliability and timestamping of each source.
Common pitfalls when reading live updates
One common trap is reacting to individual ticks rather than the trend. Another is overtrading—taking too many small bets in a single session. Anchoring bias can make you cling to a price you expect to see rather than adjusting to new information. Always note the broader context: sector rotation, economic data, and global markets influence what happens locally. Practically, set pre-defined criteria for entries and exits before you consult live data.
Strategies for reacting to updates (without overtrading)
Adopt a rules-based approach: define entry and exit thresholds, risk per trade, and a maximum number of trades per hour. Use alerts to highlight key levels instead of watching quotes constantly. When a feed bumps a price, ask two questions: Does this move violate my plan? Does the news justify a change in risk? If not, log the update and wait for confirmation across multiple data points.
Tools and platforms for reliable live updates
The landscape includes official exchange feeds, professional terminal services, financial news apps, and broker dashboards. Look for feeds with low latency, high reliability, and clear timestamps. Favor platforms that allow you to customize alerts, filter by instrument, and export data for later review. Integrate your chosen tools into a routine so you’re not overwhelmed during crowded sessions.
A practical example: interpreting a hypothetical update
Suppose a stock reports an unusual surge in volume alongside a modest price rise. If the overall market is flat and the stock has an ongoing uptrend, this could reflect renewed interest. If the surge is accompanied by a widening bid-ask spread, liquidity might be thinning. Your interpretation should weigh the direction, momentum, and timing, plus any corroborating news. This example shows how to connect a single data point to a broader decision framework.
Integrating live updates into a routine and risk management
Create a daily ritual around live updates: pre-market briefing, mid-session check-ins, and post-market review. Limit exposure by setting position sizing rules and risk limits. Use a journaling habit to capture why you acted on a feed and how the trade performed. A consistent routine reduces emotional reactions and improves long-term results.
The role of macro data and news in live updates
Macro indicators and geopolitical news heavily influence market direction, often triggering quick, multi-asset moves. Learn to separate headlines from data: read the actual figures, not the headline. Combine live quotes with economic calendars, earnings releases, and sentiment analysis to build a more complete picture. Update Bay notes that the best practice is to anchor decisions in data-driven frameworks rather than in noise.
Overview of live data factors
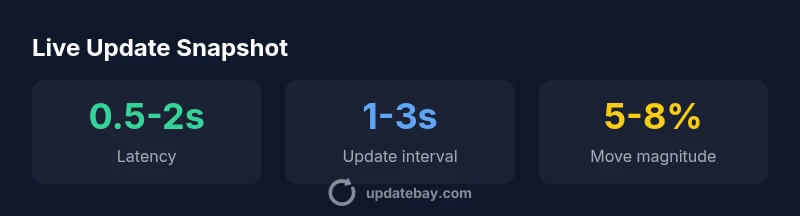
| Data Point | What it Measures | Typical Range |
|---|---|---|
| Quote latency | Time from exchange update to display | 0.5-2 seconds |
| Tick rate | Average updates per second | 1-3 seconds |
| Spread width | Liquidity proxy | Narrow to moderate |
Frequently Asked Questions
What is a live update in the share market?
A live update is a real-time stream of quotes, trades, and market data. It helps traders observe current activity and react promptly. However, interpretation requires context, latency awareness, and a defined strategy.
A live update is real-time market data that you can act on. Remember to consider latency and your trading plan before reacting.
How reliable are live market feeds?
Reliability depends on the data source, latency, and the platform's infrastructure. Use feeds from reputable exchanges and vendors, and cross-check with independent data when possible.
Reliability comes from reputable sources and good latency. Cross-check if you can.
Should beginners trade based on live updates?
Beginners should avoid overtrading on live ticks. Start with a small, well-defined plan, and use simulated or paper trading to learn how to react to updates without risking capital.
It's best to learn with a plan or simulate trades before using real money.
What is latency, and why does it matter?
Latency is the delay between a data event and its display. Lower latency improves timely decision-making but can also tempt premature moves if not managed with a plan.
Latency affects how quickly you see moves. Use it to time decisions, not to chase them.
How can I verify data during high volatility?
Verify data by cross-referencing multiple feeds, checking timestamps, and focusing on aggregated trends rather than single moves. Have a clear risk framework to guide actions.
Cross-check feeds and rely on your risk plan during volatility.
“Live market data is a powerful tool only when paired with context and discipline. Timing and source reliability are as important as the numbers themselves.”
What to Remember
- Rely on trusted feeds and note latency
- Define clear rules before reacting to updates
- Differentiate headlines from actual data
- Use routines to manage risk and emotions
- Validate data with corroborating indicators